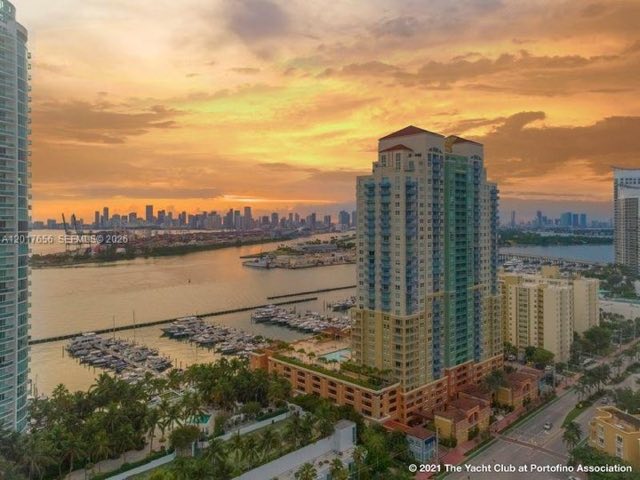
Rules
What Murano at Portofino allows
- Minimum lease
- 3 months
- Leases per year
- 2
Rules change: I confirm the current bylaws and application requirements before you write an offer or sign a lease.
1000 S Pointe Dr · Miami Beach, FL 33139 · South Beach
37-story tower, completed 2002, 189 residences in South Beach. 1 for sale and 2 for rent on Nov 2, 2026.
At a glance Murano at Portofino (1000 S Pointe Dr, South Beach) is a 37-story, 189-unit building completed in 2002. As of Nov 2, 2026, 1 unit is for sale and 2 are for rent; the median closed price was $2,092 per square foot over 7 sales in the last 12 months. FEMA flood zone AE. Source: Miami Assoc. of REALTORS® MLS via Bridge IDX, Miami-Dade Property Appraiser records and the FEMA flood map.
6 photos from my condo archive
MLS via Bridge IDX · as of Nov 2, 2026 · How these numbers are made
The weekly MLS snapshot, newest asks first. Each unit opens its full listing: photos, taxes, history. Or check the live feed for today's inventory.
Listings matched to this building's recorded addresses. I don't have to be the listing agent to show you any unit or to negotiate for you. Search condos in 33139
Every unit the MLS has recorded here, placed by its unit number: floors up, lines across, each column as wide as the units in it. Amber is for sale today (a unit listed both for sale and for rent is amber). Hover or tap a unit to read its record.
Tap a unit to read its record here. Amber and white units open their listing page.
Closed $/SF figures use the 12 recorded sales of these units in the 24 months to Nov 2, 2026; a median needs three. Floor, line and size are the record's. Views and orientation are not in it and are not shown.
Line 01 closed highest per square foot: a median $2,259/SF over 4 sales in 24 months. The largest typical unit is line 01, a median 3,365 sf over 14 units seen, recorded with 3 bedrooms.
| Line | Units seen | Typical size | Beds | On the market | Closed $/SF · 24 mo |
|---|---|---|---|---|---|
| Line 01 | 14 | 3,365 sf | 3 | 1 | $2,259 4 sales |
| Line 02 | 8 | 2,618 sf | 3 | 1 | 1 sale, too few |
| Line 03 | 9 | 2,008 sf | 3 | 1 | $1,917 3 sales |
| Line 04 | 9 | 2,190 sf | 3 | 1 | – |
| Line 05 | 7 | 1,407 sf | 2 | – | $1,848 3 sales |
| Line 06 | 5 | 1,008 sf | 1 | – | 1 sale, too few |
| Line 07 | 7 | 1,390 sf | 2 | – | – |
| Line 08 | 7 | 1,791 sf | 2 | – | – |
5 units in the record sit outside this grid (LPH04, P2803, TH A5, TH-A5, TH-A10): penthouse, townhouse or ground-level numbers, or lines seen only once or twice.
How this is drawn: a unit's floor and line come from its MLS unit number alone (5614 is floor 56, line 14). A cell exists only where the MLS has recorded a listing, a closing or a lease; a blank means no record was seen, not that no unit exists. Column widths follow each line's median recorded living area. Pre-construction towers and buildings with a thin record have no drawing.
Floor and line from the MLS unit number; a blank cell means no record was seen. How these numbers are made
Completed in 2002, Murano at Portofino stands 37 stories at 1000 S Pointe Dr in South Beach. County folio records count 189 residences, averaging 2,197 SF of living area. Sieger Suarez Architects designed it for Related Group. The condo archive records it as waterfront (bay).
One unit was for sale on November 2, 2026, asking $11M (that is $3,269/SF). One more was under contract. Seven sales closed between November 2, 2025 and November 2, 2026, from $1.9M to $10M, a median $2,092/SF, after a median 109 days on the market. In the 12 months before that, five sales closed at a median $1,848/SF, so the median rose 13%. Across 60 recorded sales since 2019, the best year by median price per square foot was 2026, at $2,092 over 7 sales. That 12-month median ranks 8th of the 83 South Beach buildings with at least three sales in the same window. Three-bedroom-plus units made up seven of the 12 sales in the last 24 months, at a median $5,750,000.
Two units were offered for rent at $18,500 to $40,000 a month. 11 leases were signed over the same 12 months, at a median $13,000 a month (range $6,200 to $35,500).
County records show 40% of residences as owner-occupied. Association rules on file: minimum lease 3 months; up to two leases a year. I have three of its association documents on file, including the Lease Application and the Sales Application.
Sources: Miami Assoc. of REALTORS® MLS via Bridge IDX (activity as of November 2, 2026), Miami-Dade Property Appraiser records and my condo archive. Blanks mean the record doesn't state it; nothing here is estimated.
Every sale and lease the MLS has recorded at this address, sales first.
Every recorded sale at this address, 2019 to 2026. Count in the tooltip.
Pale bars: fewer than three sales that year, so the bar is the sale itself or the average of two, too few for a median.
| Year | Sales | Median $/SF | Leases | Median rent |
|---|---|---|---|---|
| 2026 (to date) | 7 | $2,092 | 8 | $12,750/mo |
| 2025 | 3 | $1,724 | 8 | $15,125/mo |
| 2024 | 11 | $1,990 | 10 | $10,000/mo |
| 2023 | 5 | $1,986 | 6 | $19,750/mo |
| 2022 | 7 | $1,872 | 6 | $10,000/mo |
| 2021 | 16 | $1,459 | 10 | $9,600/mo |
| 2020 | 9 | $1,079 | 8 | $9,500/mo |
| 2019 | 2 | $1,232* | 1 | $7,500/mo* |
* Fewer than three closings that year: the figure is the closing itself or the average of two, too few for a median.
Median $/SF of the sales in the 12 months to Nov 2, 2026, with the count beside each bar.
Medians need three or more sales. How these numbers are made
Median closed $/SF in 2020: $1,079 (9 sales). In the last 12 months: $2,092 (7 sales). Change: +94%.
This is the building's movement, not your unit's value. Floor, view, line and condition move a unit's price more than the building does. Only years with three or more recorded sales are listed.
Get your unit's value →| Unit | BD | BA | SF | Asked | Closed | $/SF | Close date | DOM |
|---|---|---|---|---|---|---|---|---|
| 1501 | 3 | 3.5 | 3,365 | $7,650,000 | $7,400,000 | $2,199 | Jun 25, 2026 | 118 |
| 1706 | 1 | 1.5 | 1,008 | $1,950,000 | $1,934,000 | $1,919 | Jun 10, 2026 | 305 |
| 3501 | 3 | 3.5 | 3,365 | $10,950,000 | $10,300,000 | $3,061 | May 15, 2026 | 109 |
| 703 | 3 | 2.5 | 2,008 | $3,850,000 | $3,700,000 | $1,843 | May 1, 2026 | 136 |
| 705 | 2 | 2.5 | 1,407 | $2,700,000 | $2,700,000 | $1,919 | Apr 27, 2026 | 9 |
| 2802 | 3 | 3.5 | 2,618 | $5,950,000 | $5,750,000 | $2,196 | Apr 15, 2026 | 52 |
| 1503 | 2 | 2.5 | 2,008 | $4,425,000 | $4,200,000 | $2,092 | Apr 9, 2026 | 26 |
| 1505 | 2 | 2.5 | 1,407 | $2,490,000 | $2,425,000 | $1,724 | Sep 30, 2025 | 11 |
| 501 | 3 | 3.5 | 3,365 | $6,275,000 | $5,270,000 | $1,566 | Jun 2, 2025 | 181 |
| 2901 | 3 | 3.5 | 3,365 | $8,900,000 | $7,800,000 | $2,318 | Feb 5, 2025 | 195 |
| 2503 | 3 | 2.5 | 2,008 | $4,300,000 | $3,850,000 | $1,917 | Nov 22, 2024 | 32 |
| 705 | 2 | 2.5 | 1,407 | $2,875,000 | $2,600,000 | $1,848 | Nov 20, 2024 | 193 |
| Unit | BD | BA | SF | Asked/mo | Leased/mo | $/SF/mo | Lease date | DOM |
|---|---|---|---|---|---|---|---|---|
| 1706 | 1 | 1.5 | 1,008 | $13,000/mo | $13,000/mo | $12.90 | Oct 13, 2026 | 10 |
| 506 | 1 | 1.5 | 1,008 | $8,000/mo | $7,000/mo | $6.94 | Aug 1, 2026 | 0 |
| 405 | 2 | 2.5 | 1,407 | $10,000/mo | $10,000/mo | $7.11 | Jul 1, 2026 | 23 |
| 904 | 3 | 3 | 2,190 | $19,000/mo | $17,000/mo | $7.76 | Jun 10, 2026 | 84 |
| PH-2804 | 3 | 3.5 | 2,850 | $30,000/mo | $27,000/mo | $9.47 | May 15, 2026 | 85 |
| 1007 | 2 | 2.5 | 1,390 | $12,500/mo | $12,500/mo | $8.99 | Feb 12, 2026 | 15 |
| 201 | 2 | 2.5 | 1,515 | $11,500/mo | $11,000/mo | $7.26 | Feb 3, 2026 | 19 |
| 1706 | 1 | 1.5 | 1,008 | $13,500/mo | $13,500/mo | $13.39 | Jan 5, 2026 | 201 |
| 506 | 1 | 1.5 | 1,008 | $9,000/mo | $6,200/mo | $6.15 | Dec 19, 2025 | 184 |
| 3301 | 3 | 3.5 | 3,365 | $40,000/mo | $35,500/mo | $10.55 | Dec 1, 2025 | 47 |
| 2202 | 3 | 3.5 | 2,618 | $35,000/mo | $35,000/mo | $13.37 | Nov 7, 2025 | 20 |
Data: Miami Assoc. of REALTORS® MLS via Bridge IDX, as of Nov 2, 2026. Listings matched to this building's recorded addresses; pending includes under-contract. Closed listings shown as records only, no photos. Blanks mean the record doesn't state it. How these numbers are made
The rules on record, the documents in my files, the two Florida checks every buyer should run, and the buildings around it. Each card opens.
Rules
Rules change: I confirm the current bylaws and application requirements before you write an offer or sign a lease.
Documents
The documents most buyers and renters can't get until they're deep in a deal. Tap one and I'll send it with my read on what matters in it.
FEMA flood zone
Inside FEMA's Special Flood Hazard Area. A federally backed mortgage requires flood insurance here.
FEMA National Flood Hazard Layer, checked at the building's mapped location on Oct 12, 2026. Open the official map ↗
Milestone structural inspection
Due by statute by December 31, 2032, 30 years after 2002, then every 10 years.
Fla. Stat. § 553.899(3) ↗ and Miami-Dade recertification ↗, read Oct 9, 2026. What the deadline means for buyers
Nearby
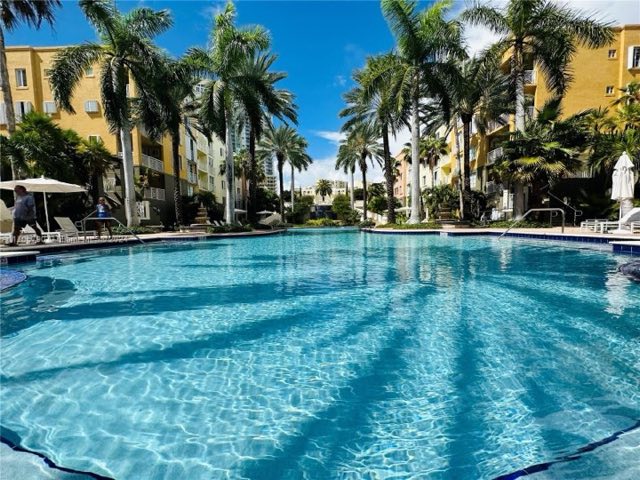 The Courts at South Beach · 6 buildings190 m away · Built 1996 · 4 floors5 for sale · 2 for lease
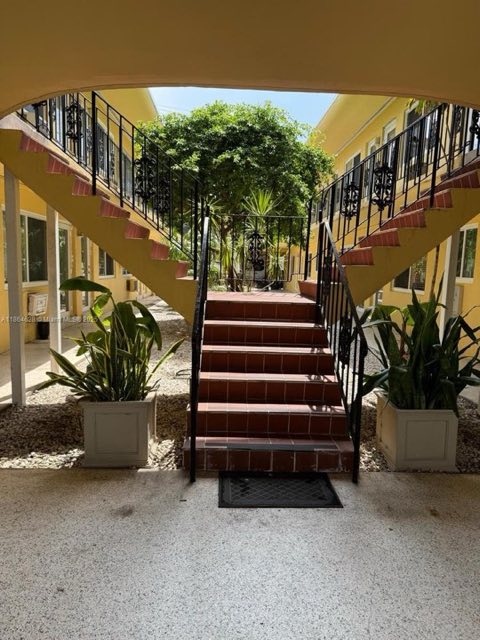 Golden Dreams270 m away · Built 1960 · 2 floors3 for sale · 0 for lease
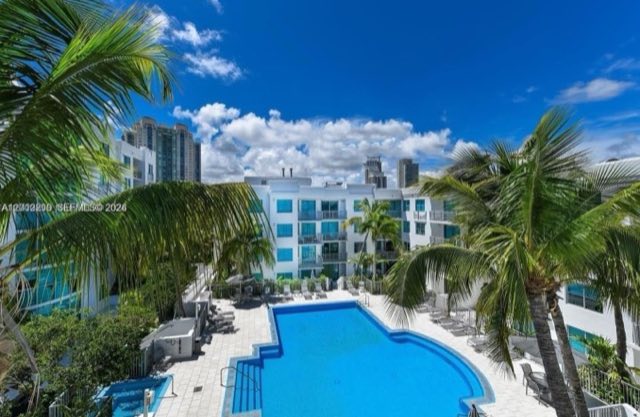 The Cosmopolitan Building 2320 m away · Built 2004 · 8 floors4 for sale · 2 for lease
Smaller buildings close by: All Corners (350 m) · Claris (380 m) · The Gramercy (440 m) · Riva (450 m) · 300 Meridian Place (460 m) · El Cyclon (460 m)
Compare with the two nearest →Every South Beach building →Distances are straight-line. Building data from Miami Assoc. of REALTORS® MLS records via Bridge IDX.
Own here, or looking here
Owners: tell me your unit and I'll prepare its value myself. Buyers and renters: I'll tell you when a unit here lists or sells. Either way it starts a conversation with me, not a mailing list.

I read the building before you buy or sell a unit in it.Closed history, the association's rules, what is really for sale and what it should trade at. Then we talk.