
CondoHub · The Miami Condo Atlas
Every condo building. One map.
Every delivered condo building from Coconut Grove to Sunny Isles: year built, height, size and live market activity, from verified MLS records. Watching what's not built yet? That's PreDevHub.
Miami MLS via Bridge IDX · as of Oct 9, 2026
Browse the atlas
Tiles © EsriPins show every building that matches the filters. Draw an area to narrow further.
Building data compiled from Miami Assoc. of REALTORS® MLS records via Bridge IDX. Figures shown only where the record supports them: blanks are left blank, never guessed. Satellite thumbnails © Esri, Maxar, Earthstar Geographics. Spotted an error in your building? Tell me and I'll verify it →
The skyline, in numbers
What 100 years of Miami condos look like.
Delivered buildings only, Coconut Grove to Sunny Isles. Pre-construction towers are counted on PreDevHub, not here.
Buildings by decade built
The 2020s are still filling
Show as a table
| Decade | Buildings |
|---|
Tallest in the atlas
Floors on record. Tap a row to open the building.
Building intelligence reports
Pick any building up there. I'll hand you the full dossier.
The atlas is the index. The report is the intelligence. For any building on that map, I build a full building dossier from the same verified MLS data:
- Closed history: every recorded sale and rental, sortable by year and unit type.
- Price-per-foot trend: where the building has been trading, year over year.
- What's available now: active sales and rentals, and what's pending.
- The honest read: how it comps against its neighbors, and what that means for your unit or your offer.
Free, no strings. Whether you own there, want in, or are just watching, it's the same data the pros use, in plain English.
 Live example
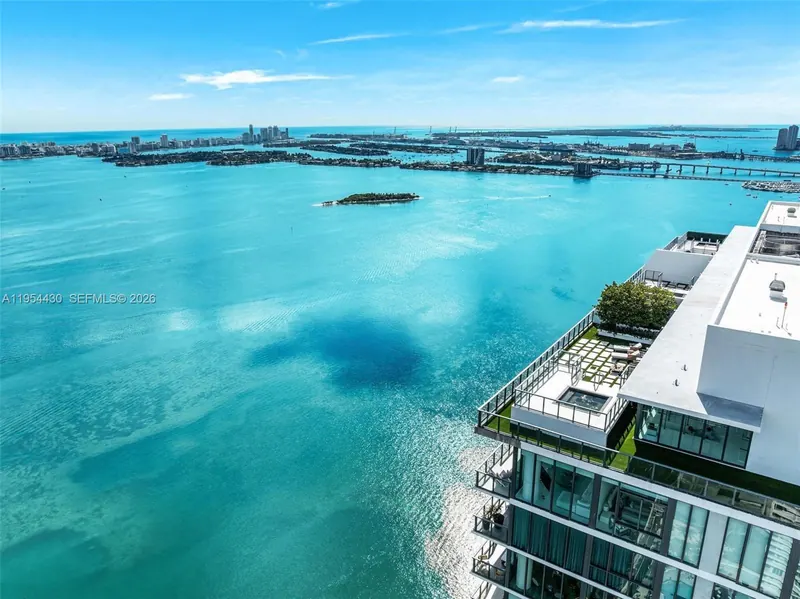
One Paraiso · Edgewater
273 residences · 53 stories · Related Group, 2018. The full report, live on this site.
See the One Paraiso report →Straight answers
CondoHub, explained.
Not covered here? Ask me on WhatsApp or call 786-578-6900. Straight answers, same day.
Where does this data come from?
My building is missing, or a detail looks wrong.
What exactly is a building intelligence report?
I own a unit. What's it actually worth?
Do you track new construction and pre-construction?
Nothing's listed in the building I want. Now what?
Condo directory · 2,049 buildings with their own page
By neighborhood: Coconut Grove · Coral Gables · Key Biscayne · Brickell · Downtown · Edgewater · Midtown · Fisher Island · South Beach · Mid-Beach · North Beach · Miami Beach · Surfside · Bal Harbour · Bay Harbor Islands · Sunny Isles Beach · Aventura · Full directory →
Building-level advantage
The atlas is public. The intelligence isn't.
Anyone can browse this map. What you can't get from a portal: the building's full closed history, what units really trade for, which lines to avoid, and who might sell before anything lists. Tell me the building. I'll do the digging.

Name the building. I'll send the numbers.Closed history, the $/SF trend and what's really available, usually the same day, free.
Licensed Florida Real Estate Agent · Carmona Realty Group
What you'll get back
- Your building's report: closed history, $/SF trend, actives and bed mix.
- A straight answer: buy, sell, hold or walk, backed by the comps.
- Off-market reach: direct owner outreach in buildings with nothing listed.