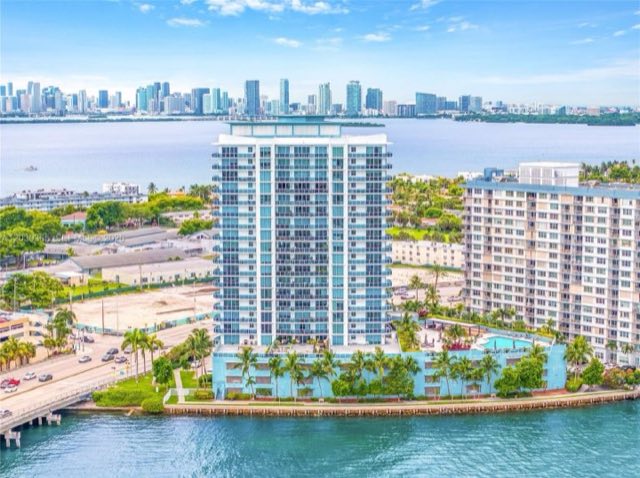
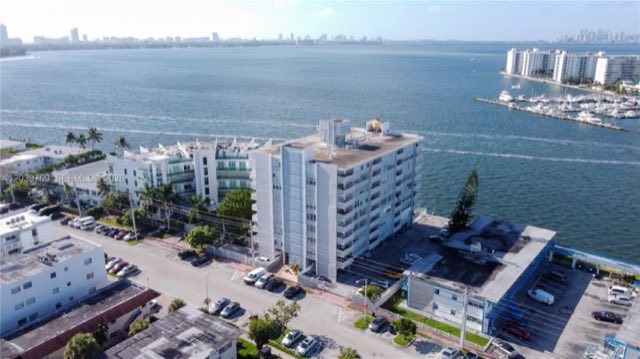
7501 E Treasure Dr · Miami Beach, FL 33141 · North Beach

Treasures on the Bay II

Condominium, completed 1965, 160 residences in North Beach. 8 for sale and 5 for rent on Nov 2, 2026.

Tell me your unit and I'll prepare its value myself, from Treasures on the Bay II's closed sales and what is listed now. Then we talk it through.

Phone or email. One is enough.

Thinking about

Goes to Enrique only. No mailing list.

When a unit at Treasures on the Bay II lists or sells, I'll let you know. I send these myself, not a robot.

Phone or email. One is enough.

Alerts for

Goes to Enrique only. No mailing list.

At a glance Treasures on the Bay II (7501 E Treasure Dr, North Beach) is a 160-unit building completed in 1965. As of Nov 2, 2026, 8 units are for sale and 5 are for rent; the median closed price was $282 per square foot over 8 sales in the last 12 months. FEMA flood zone AE. Source: Miami Assoc. of REALTORS® MLS via Bridge IDX, Miami-Dade Property Appraiser records and the FEMA flood map.

For sale
8
For rent
5
Median $/SF
$2828 sales · 12 mo
Sold
8last 12 months
Built
1965
Residences
160county
Flood zone
AEFEMA
Owner-occupied
41%
Avg. unit
968sq ft
HOA dues
$0.98/SF/mo · 8 listings

MLS via Bridge IDX · as of Nov 2, 2026 · How these numbers are made

On the market at Treasures on the Bay II.

The weekly MLS snapshot, newest asks first. Each unit opens its full listing: photos, taxes, history. Or check the live feed for today's inventory.

Snapshot as of Nov 2, 2026.

Under contract 1

  • Unit 4K$335,000 · 2 bd

Listings matched to this building's recorded addresses. I don't have to be the listing agent to show you any unit or to negotiate for you. Search condos in 33141

Treasures on the Bay II, floor by floor.

Every unit the MLS has recorded here, placed by its unit number: floors up, lines across, each column as wide as the units in it. Amber is for sale today (a unit listed both for sale and for rent is amber). Hover or tap a unit to read its record.

112 units seen · MLS via Bridge IDX · as of Nov 2, 2026
  • For sale 8
  • Under contract 1
  • For rent 3
  • Sold or leased, last 12 months 17
  • Seen in the MLS before that 83
  • No MLS record seen 48
ABCDEFGHJKLMNPRST1015ABCDEFGHJKLMNPRST1015

Tap a unit to read its record here. Amber and white units open their listing page.

Units seen112of 160 residences on record
Floors with units10floors 1 to 10
Lines16stacks of units, by number

Closed $/SF by height sales in the 24 months to Nov 2, 2026

Upper floorsfloors 9 to 101 sale, too few for a median
Middle floorsfloors 5 to 8$306/SF · 6 sales
Lower floorsfloors 1 to 4$294/SF · 12 sales

Closed $/SF figures use the 19 recorded sales of these units in the 24 months to Nov 2, 2026; a median needs three. Floor, line and size are the record's. Views and orientation are not in it and are not shown.

The largest typical unit is line EF, a median 1,330 sf over 9 units seen, recorded with 3 bedrooms.

The lines what the MLS record holds for each stack of units
LineUnits seenTypical sizeBedsOn the marketClosed $/SF · 24 mo
Line A9825 sf111 sale, too few
Line B6825 sf1–1 sale, too few
Line C8825 sf112 sales, too few
Line D5885 sf111 sale, too few
Line EF91,330 sf31–
Line G7825 sf1–1 sale, too few
Line H7825 sf132 sales, too few
Line J81,130 sf2––
Line K71,130 sf212 sales, too few
Line L6825 sf111 sale, too few
Line M91,100 sf2–2 sales, too few
Line N81,100 sf2––
Line P61,145 sf211 sale, too few
Line R7825 sf112 sales, too few
Line S6825 sf112 sales, too few
Line T41,065 sf2–1 sale, too few

4 units in the record sit outside this grid (4E, PH K, PH-B, PH-K): penthouse, townhouse or ground-level numbers, or lines seen only once or twice.

How this is drawn: a unit's floor and line come from its MLS unit number alone (5614 is floor 56, line 14). A cell exists only where the MLS has recorded a listing, a closing or a lease; a blank means no record was seen, not that no unit exists. Column widths follow each line's median recorded living area. Pre-construction towers and buildings with a thin record have no drawing.

Floor and line from the MLS unit number; a blank cell means no record was seen. How these numbers are made

The read on Treasures on the Bay II.

Activity as of Nov 2, 2026
  • Resale +45%. The median closed price moved from $201/SF in 2020 (9 sales) to $291/SF in 2026 (6 sales), the first and last years with three or more recorded sales.
  • Gross rental yield 11.1%. A year of rent at the median $2.60/SF/mo (11 leases) against the median $282/SF sale (8 sales), both over 12 months, before HOA, taxes and vacancy.
  • Asks run +13% against closings. Sellers ask a median $318/SF (8 listings) against $282/SF closed (8 sales, 12 months). That gap is negotiation room. Bring the comps.
  • Sells in a median 101 days. Days on market across the 8 sales closed in the last 12 months.

Where it ranks citywide, condo buildings in 17 Miami neighborhoods

  • #39 of 384 · highest gross rent yield10.13% gross rent yield, before HOA, taxes and vacancy · n 28 · Oct 2024 to Sep 2026
  • #40 of 360 · closest to asking price96.4% of asking, median · n 17 · Oct 2024 to Sep 2026

See the full rankings · How rankings are made

Read the full record 4 paragraphs and 9 facts, every figure from the MLS and county record

Treasures on the Bay II is a condominium at 7501 E Treasure Dr in North Beach, built in 1965. The Miami-Dade Property Appraiser lists 160 residential units, averaging 968 SF of living area.

On November 2, 2026, eight units were listed for sale, asking $245K to $529K (median ask $318/SF across 8 listings). One more was under contract. Eight sales closed between November 2, 2025 and November 2, 2026, from $235K to $335K, a median $282/SF, after a median 101 days on the market. In the 12 months before that, 11 sales closed at a median $300/SF, so the median fell 6%. The MLS holds 83 closed sales here going back to 2019; among years with three or more sales, 2024 set the high at a median $324/SF. That 12-month median ranks 41st of the 45 North Beach buildings with at least three sales in the same window. One-bedrooms made up 13 of the 19 sales in the last 24 months, at a median $250,000.

Five units were offered for rent at $2,200 to $2,400 a month. 11 leases were signed over the same 12 months, at a median $2,300 a month (range $2,000 to $3,650).

About 41% of the residences are owner-occupied according to county records.

Sources: Miami Assoc. of REALTORS® MLS via Bridge IDX (activity as of November 2, 2026), Miami-Dade Property Appraiser records. Blanks mean the record doesn't state it; nothing here is estimated.

The record

Address
7501 E Treasure Dr, Miami Beach 33141
Neighborhood
North Beach
Year built
1965
Residences (county-verified)
160
Owner-occupied
41% of residences
Avg. unit size
968 sq ft
Total living area
154,850 sq ft
County condo folios
160
Recorded MLS listings
1

The numbers at Treasures on the Bay II.

Every sale and lease the MLS has recorded at this address, sales first.

MLS via Bridge IDX · as of Nov 2, 2026

Median $/SF by year closed

Every recorded sale at this address, 2019 to 2026. Count in the tooltip.

$162$324$2022019$2012020$2332021$2592022$3072023$3242024$2982025$2912026$162$324$202'19'20$233'21'22'23$324'24'25$291'26

Pale bars: fewer than three sales that year, so the bar is the sale itself or the average of two, too few for a median.

Year by year, every recorded closing
YearSalesMedian $/SFLeasesMedian rent
2026 (to date)6$2918$2,325/mo
202513$29814$2,100/mo
202411$32420$2,200/mo
202310$30716$2,300/mo
202215$25914$2,450/mo
202118$23315$1,800/mo
20209$20116$1,575/mo
20191$202*4$1,725/mo

* Fewer than three closings that year: the figure is the closing itself or the average of two, too few for a median.

Closed $/SF by unit size

Median $/SF of the sales in the 12 months to Nov 2, 2026, with the count beside each bar.

1 bedroom$309/SF · 3 sales
2 bedrooms$277/SF · 5 sales

Medians need three or more sales. How these numbers are made

Own here? See how the building moved since you bought.

Median closed $/SF in 2020: $201 (9 sales). In the last 12 months: $282 (8 sales). Change: +40%.

This is the building's movement, not your unit's value. Floor, view, line and condition move a unit's price more than the building does. Only years with three or more recorded sales are listed.

Get your unit's value →
Show all closings 83 sales · 107 leases on record since 2019

Closed sales Nov 2, 2024 to Nov 2, 2026 · 19

UnitBDBASFAskedClosed$/SFClose dateDOM
6K221,130$349,000$335,000$296Oct 26, 202666
8B11825$240,000$235,000$285Oct 26, 2026169
2S11825$265,000$255,000$309Oct 26, 202666
3M211,100$295,000$275,000$250Mar 20, 202634
1K221,130$315,000$315,000$279Mar 13, 2026393
5R11825$289,000$283,000$343Feb 27, 202615
1P221,145$299,000$299,000$261Dec 9, 2025136
6T221,065$355,000$295,000$277Nov 19, 2025244
3C11825$260,000$245,000$297Sep 10, 2025360
4H11825$264,900$250,000$303Aug 13, 2025194
2G11825$247,500$247,500$300Aug 8, 202514
9D11885$280,000$270,000$305Jul 1, 202511
2L11825$249,000$240,000$291Jun 30, 2025143
1H11825$249,900$246,000$298May 23, 2025105
4C11825$269,000$260,000$315Apr 15, 202536
8R11825$265,000$260,000$315Mar 19, 202549
6S11825$275,000$265,000$321Mar 17, 2025113
1A11825$259,000$230,000$279Mar 17, 202540
2M211,100$299,000$287,500$261Jan 16, 2025111

Leases signed Nov 2, 2025 to Nov 2, 2026 · 11

UnitBDBASFAsked/moLeased/mo$/SF/moLease dateDOM
5H11825$2,100/mo$2,000/mo$2.42Oct 14, 202670
3H11825$2,200/mo$2,200/mo$2.67Sep 22, 202641
7M211,100$2,700/mo$2,700/mo$2.45Aug 1, 202683
8A11825$2,300/mo$2,300/mo$2.79Jul 7, 20267
3D11885$2,400/mo$2,300/mo$2.60Jun 5, 202648
2N221,100$2,400/mo$2,350/mo$2.14Jun 5, 202612
9EF321,330$3,795/mo$3,650/mo$2.74Jun 1, 2026129
8n221,100$2,900/mo$2,900/mo$2.64May 5, 20260
6R11825$2,150/mo$2,100/mo$2.55Dec 26, 202592
2C11825$2,200/mo$2,000/mo$2.42Dec 5, 202562
6A11825$2,300/mo$2,300/mo$2.79Dec 1, 202552

Data: Miami Assoc. of REALTORS® MLS via Bridge IDX, as of Nov 2, 2026. Listings matched to this building's recorded addresses; pending includes under-contract. Closed listings shown as records only, no photos. Blanks mean the record doesn't state it. How these numbers are made

The file on Treasures on the Bay II.

The rules on record, the documents in my files, the two Florida checks every buyer should run, and the buildings around it. Each card opens.

FEMA flood zone

AE

Inside FEMA's Special Flood Hazard Area. A federally backed mortgage requires flood insurance here.

What the zone means
  • The 1% annual chance ("100-year") flood area, with a base flood elevation set.
  • Base flood elevation 10 ft (NGVD29).
  • The zone is a map line, not a premium. Ask the association for its master flood policy, and get a flood quote for the specific unit before you commit.

FEMA National Flood Hazard Layer, checked at the building's mapped location on Oct 12, 2026. Open the official map ↗

Nearby

Around Treasures on the Bay II

5 more nearby

Compare with the two nearest →Every North Beach building →Distances are straight-line. Building data from Miami Assoc. of REALTORS® MLS records via Bridge IDX.

Own here, or looking here

Owners: tell me your unit and I'll prepare its value myself. Buyers and renters: I'll tell you when a unit here lists or sells. Either way it starts a conversation with me, not a mailing list.

Own here?

Get your unit's value

Tell me your unit and I'll prepare its value myself, from Treasures on the Bay II's closed sales and what is listed now. Then we talk it through.

Phone or email. One is enough.

Thinking about

Goes to Enrique only. No mailing list.

Looking here?

Get alerts when a unit lists or sells

When a unit at Treasures on the Bay II lists or sells, I'll let you know. I send these myself, not a robot.

Phone or email. One is enough.

Alerts for

Goes to Enrique only. No mailing list.

Enrique Ponte Ojeda on a balcony overlooking the water in Miami
I read the building before you buy or sell a unit in it.Closed history, the association's rules, what is really for sale and what it should trade at. Then we talk.
Enrique Ponte Ojeda
Licensed Florida Real Estate Agent · Carmona Realty Group