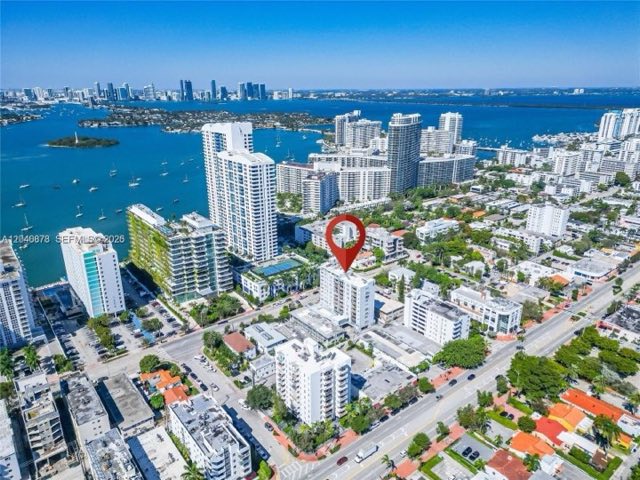
1330 W W Ave · Miami Beach, FL 33139 · South Beach

The Waverly at South Beach

36-story tower, completed 2001, 395 residences in South Beach. 16 for sale and 4 for rent on Nov 2, 2026.

Tell me your unit and I'll prepare its value myself, from The Waverly at South Beach's closed sales and what is listed now. Then we talk it through.

Phone or email. One is enough.

Thinking about

Goes to Enrique only. No mailing list.

When a unit at The Waverly at South Beach lists or sells, I'll let you know. I send these myself, not a robot.

Phone or email. One is enough.

Alerts for

Goes to Enrique only. No mailing list.

At a glance The Waverly at South Beach (1330 W W Ave, South Beach) is a 36-story, 395-unit building completed in 2001. As of Nov 2, 2026, 16 units are for sale and 4 are for rent; the median closed price was $750 per square foot over 12 sales in the last 12 months. FEMA flood zone AE. Source: Miami Assoc. of REALTORS® MLS via Bridge IDX, Miami-Dade Property Appraiser records and the FEMA flood map.

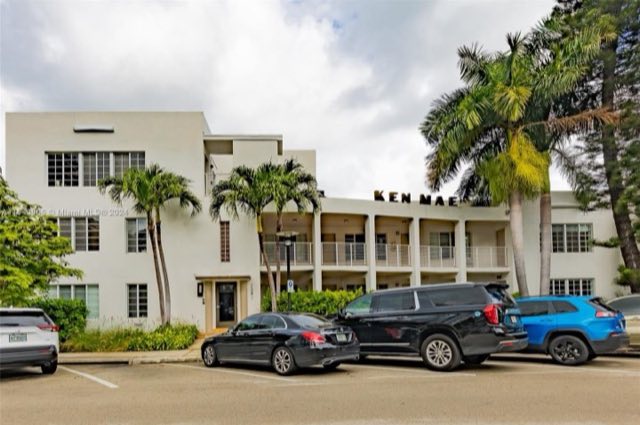
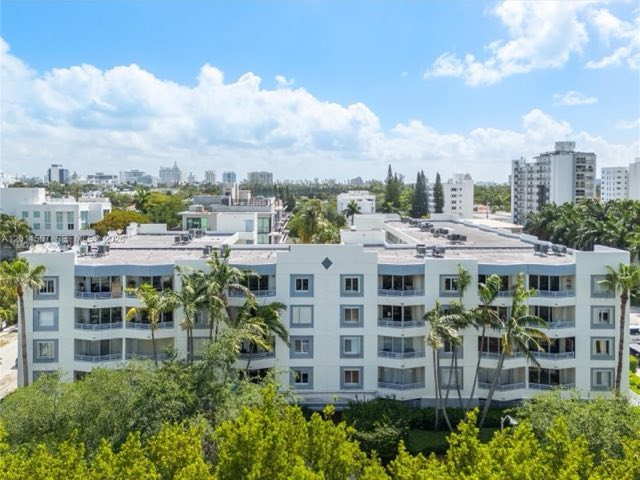
6 photos from my condo archive

For sale
16
For rent
4
Median $/SF
$75012 sales · 12 mo
Sold
12last 12 months
Built
2001
Floors
36
Residences
395county
Flood zone
AEFEMA
Owner-occupied
49%
Avg. unit
1,106sq ft

MLS via Bridge IDX · as of Nov 2, 2026 · How these numbers are made

On the market at The Waverly at South Beach.

The weekly MLS snapshot, newest asks first. Each unit opens its full listing: photos, taxes, history. Or check the live feed for today's inventory.

Snapshot as of Nov 2, 2026.

For sale 16 listings · Nov 2, 2026

Unit PH02$1,649,000$1,520/SF2 bd · 2 ba · 1,085 sf9 days listed · $1,525/mo HOA · listed by The Agency Florida LLCFull listing →Unit 2908$1,500,000$1,084/SF2 bd · 2 ba · 1,384 sflisted today · $1,921/mo HOA · listed by Silverleaf Realty GroupFull listing →Unit 708$1,395,0002 bd · 2 ba8 days listed · $1,920/mo HOA · listed by Aura MiamiFull listing →Unit 3404$1,250,000$1,153/SF2 bd · 2 ba · 1,084 sf299 days listed · $1,026/mo HOA · listed by Sara David RealtyFull listing →Unit 3007$1,199,000$945/SF2 bd · 2 ba · 1,269 sf503 days listed · $1,590/mo HOA · listed by Related General Realty, LLC.Full listing →Unit 3407$1,147,000$1,023/SF2 bd · 2 ba · 1,121 sf28 days listed · $1,574/mo HOA · listed by Coldwell Banker RealtyFull listing →Unit 702$1,090,000$864/SF2 bd · 2 ba · 1,262 sf2 days listed · $1,759/mo HOA · listed by Live Realty, IncFull listing →Unit 1506$980,000$870/SF2 bd · 2 ba · 1,127 sflisted today · $1,581/mo HOA · listed by Compass Florida, LLCFull listing →Unit 2107$949,000$748/SF2 bd · 2 ba · 1,269 sf94 days listed · $1,768/mo HOA · listed by Compass Florida, LLCFull listing →Unit 1111$795,000$733/SF2 bd · 2 ba · 1,084 sf2 days listed · listed by London Foster RealtyFull listing →Unit 1811$789,000$728/SF2 bd · 2 ba · 1,084 sf133 days listed · $1,524/mo HOA · listed by Coldwell Banker RealtyFull listing →Unit 614$695,000$551/SF2 bd · 2 ba · 1,262 sf1 day listed · listed by London Foster RealtyFull listing →Unit 811$659,000$608/SF2 bd · 2 ba · 1,084 sf24 days listed · $1,524/mo HOA · listed by Compass Florida, LLCFull listing →Unit 1712$510,000$633/SF1 bd · 1 ba · 806 sf309 days listed · $1,042/mo HOA · listed by BHHS EWM RealtyFull listing →Unit 2412$499,000$619/SF1 bd · 1 ba · 806 sf41 days listed · $1,270/mo HOA · listed by Compass Florida, LLCFull listing →Unit 610$485,000$612/SF1 bd · 1 ba · 793 sf246 days listed · $1,157/mo HOA · listed by Compass Florida, LLCFull listing →

Under contract 2

  • Unit PH05$1,550,000 · 2 bd
  • Unit 1514$7,000/mo · 2 bd

Listings matched to this building's recorded addresses. I don't have to be the listing agent to show you any unit or to negotiate for you. Search condos in 33139

The Waverly at South Beach, floor by floor.

Every unit the MLS has recorded here, placed by its unit number: floors up, lines across, each column as wide as the units in it. Amber is for sale today (a unit listed both for sale and for rent is amber). Hover or tap a unit to read its record.

236 units seen · MLS via Bridge IDX · as of Nov 2, 2026
  • For sale 15
  • Under contract 1
  • For rent 3
  • Sold or leased, last 12 months 43
  • Seen in the MLS before that 174
  • No MLS record seen 226
0102030405060708091011121314364302520151001020304050607080910111213143643025201510Floors 1 to 3: no unit seen in the MLSFloors 1 to 3: no unit seen in the MLS

Tap a unit to read its record here. Amber and white units open their listing page.

Units seen236of 395 residences on record
Floors with units32floors 4 to 36
Lines14stacks of units, by number

Closed $/SF by height sales in the 24 months to Nov 2, 2026

Upper floorsfloors 27 to 36$926/SF · 6 sales
Middle floorsfloors 16 to 26$650/SF · 9 sales
Lower floorsfloors 4 to 15$657/SF · 12 sales

Closed $/SF figures use the 27 recorded sales of these units in the 24 months to Nov 2, 2026; a median needs three. Floor, line and size are the record's. Views and orientation are not in it and are not shown.

Line 08 closed highest per square foot: a median $820/SF over 3 sales in 24 months. The largest typical unit is line 08, a median 1,384 sf over 14 units seen, recorded with 2 bedrooms.

The lines what the MLS record holds for each stack of units
LineUnits seenTypical sizeBedsOn the marketClosed $/SF · 24 mo
Line 01171,262 sf2–1 sale, too few
Line 02151,262 sf211 sale, too few
Line 0320806 sf1–2 sales, too few
Line 04181,084 sf21$627 3 sales
Line 0519793 sf112 sales, too few
Line 06191,127 sf211 sale, too few
Line 07171,269 sf231 sale, too few
Line 08141,384 sf22$820 3 sales
Line 09121,127 sf211 sale, too few
Line 1020793 sf12$684 4 sales
Line 11171,084 sf23$613 3 sales
Line 1219806 sf122 sales, too few
Line 13161,262 sf2––
Line 14131,262 sf22$753 3 sales

5 units in the record sit outside this grid (PH 5, PH-01, PH02, PH03, PH05): penthouse, townhouse or ground-level numbers, or lines seen only once or twice.

How this is drawn: a unit's floor and line come from its MLS unit number alone (5614 is floor 56, line 14). A cell exists only where the MLS has recorded a listing, a closing or a lease; a blank means no record was seen, not that no unit exists. Column widths follow each line's median recorded living area. Pre-construction towers and buildings with a thin record have no drawing.

Floor and line from the MLS unit number; a blank cell means no record was seen. How these numbers are made

The read on The Waverly at South Beach.

Activity as of Nov 2, 2026
  • Resale +97%. The median closed price moved from $382/SF in 2019 (4 sales) to $753/SF in 2026 (11 sales), the first and last years with three or more recorded sales.
  • Gross rental yield 6.9%. A year of rent at the median $4.33/SF/mo (37 leases) against the median $750/SF sale (12 sales), both over 12 months, before HOA, taxes and vacancy.
  • Asks run 0% against closings. Sellers ask a median $748/SF (15 listings) against $750/SF closed (12 sales, 12 months). Asks are priced close to what actually closes here.
  • Sells in a median 58 days. Days on market across the 12 sales closed in the last 12 months.
  • A renters' building. Leases outnumbered sales 3 to 1 over the last 12 months (37 leases, 12 sales), at a median $4,500 a month.

Where it ranks citywide, condo buildings in 17 Miami neighborhoods

  • #5 of 360 · fastest median days on market33 days median on market · n 27 · Oct 2024 to Sep 2026
  • #71 of 360 · closest to asking price95.9% of asking, median · n 27 · Oct 2024 to Sep 2026

See the full rankings · How rankings are made

Read the full record 4 paragraphs and 14 facts, every figure from the MLS and county record

Completed in 2001, The Waverly at South Beach stands 36 stories at 1330 W W Ave in South Beach. County folio records count 395 residences plus nine commercial units, averaging 1,106 SF of living area. The architect of record is Arquitectonica. The condo archive records it as waterfront (bay).

16 units were for sale on November 2, 2026, asking $485K to $1.6M (median ask $748/SF across 15 listings). One more was under contract. 12 sales closed between November 2, 2025 and November 2, 2026, from $520K to $2.4M, a median $750/SF, after a median 58 days on the market. In the 12 months before that, 16 sales closed at a median $669/SF, so the median rose 12%. Across 165 recorded sales since 2019, the best year by median price per square foot was 2026, at $753 over 11 sales. That 12-month median ranks 35th of the 83 South Beach buildings with at least three sales in the same window. Two-bedrooms made up 17 of the 28 sales in the last 24 months, at a median $950,000.

Four units were offered for rent at $3,400 to $7,000 a month. 37 leases were signed over the same 12 months, at a median $4,500 a month (range $3,000 to $13,500). Leases outnumbered sales 3 to 1 over that year, so renters are a large share of who lives here.

County records show 49% of residences as owner-occupied.

Sources: Miami Assoc. of REALTORS® MLS via Bridge IDX (activity as of November 2, 2026), Miami-Dade Property Appraiser records and my condo archive. Blanks mean the record doesn't state it; nothing here is estimated.

The record

Address
1330 W W Ave, Miami Beach 33139
Neighborhood
South Beach
Architect
Arquitectonica
Front desk / mgmt
(305) 674-5880
Year built
2001
Floors
36
Residences (county-verified)
395
Commercial units
9
Owner-occupied
49% of residences
Avg. unit size
1,106 sq ft
Total living area
436,867 sq ft
County condo folios
404
Waterfront
Yes / Bay
Recorded MLS listings
490

The numbers at The Waverly at South Beach.

Every sale and lease the MLS has recorded at this address, sales first.

MLS via Bridge IDX · as of Nov 2, 2026

Median $/SF by year closed

Every recorded sale at this address, 2019 to 2026. Count in the tooltip.

$377$753$3822019$4622020$5312021$6282022$7442023$6602024$6582025$7532026$377$753$382'19'20$531'21'22$744'23'24'25$753'26
Year by year, every recorded closing
YearSalesMedian $/SFLeasesMedian rent
2026 (to date)11$75334$4,425/mo
202515$65836$4,600/mo
202418$66037$4,000/mo
202318$74438$4,700/mo
202238$62845$4,300/mo
202145$53143$3,200/mo
202016$46254$2,875/mo
20194$3826$3,025/mo

Own here? See how the building moved since you bought.

Median closed $/SF in 2019: $382 (4 sales). In the last 12 months: $750 (12 sales). Change: +96%.

This is the building's movement, not your unit's value. Floor, view, line and condition move a unit's price more than the building does. Only years with three or more recorded sales are listed.

Get your unit's value →
Show all closings 165 sales · 293 leases on record since 2019

Closed sales Nov 2, 2024 to Nov 2, 2026 · 28

UnitBDBASFAskedClosed$/SFClose dateDOM
3001221,262$1,299,000$1,250,000$990Oct 21, 202686
3206221,127$1,147,000$1,100,000$976Aug 11, 2026133
2414221,262$1,030,000$1,030,000$816Jul 1, 20261
1711221,084$828,999$810,000$747Jun 2, 202690
1904221,084$750,000$680,000$627May 1, 2026417
PH-01332,582$2,599,000$2,350,000$910Apr 30, 2026171
1614221,262$749,000$736,500$584Apr 22, 202624
2311221,084$674,000$665,000$613Apr 7, 202628
2708221,384$1,599,000$1,500,000$1,084Mar 23, 202644
1414221,262$999,000$950,000$753Feb 18, 202632
150311806$549,000$530,000$658Jan 30, 202672
90511793$530,000$520,000$656Dec 22, 202530
1908221,384$1,139,000$900,000$650Oct 17, 2025196
909221,127$669,900$649,000$576Oct 14, 2025172
902221,262$1,095,000$975,000$773Sep 2, 202571
81011793$595,000$544,400$687Jul 15, 202527
300311806$559,000$530,000$658Jun 25, 202529
407221,350$979,000$950,000$704Jun 20, 20256
121211806$498,000$495,000$614May 22, 202572
241011793$621,550$610,000$769May 15, 202515
808221,384$1,250,000$1,135,000$820May 1, 202529
201011793$565,000$540,000$681Apr 22, 20257
411221,084$669,000$637,500$588Mar 17, 202513
3304221,084$1,050,000$950,000$876Feb 26, 202527
161211806$525,000$515,000$639Feb 21, 2025280
51011793$549,000$520,000$656Feb 11, 202533
270511793$595,000$574,000$724Nov 21, 2024331
504221,084$650,000$650,000$600Nov 13, 2024153

Leases signed Nov 2, 2025 to Nov 2, 2026 · 37

UnitBDBASFAsked/moLeased/mo$/SF/moLease dateDOM
1207221,350$4,950/mo$4,800/mo$3.56Oct 23, 202631
2601221,262$5,650/mo$5,650/mo$4.48Oct 1, 202666
1406221,127$5,000/mo$5,000/mo$4.44Sep 24, 202624
71211806$3,150/mo$3,000/mo$3.72Sep 1, 202612
160311806$4,000/mo$3,800/mo$4.71Aug 15, 202641
221211806$3,600/mo$3,500/mo$4.34Aug 1, 202625
210511793$3,700/mo$3,700/mo$4.67Aug 1, 202614
61011793$3,400/mo$3,300/mo$4.16Jul 31, 202615
711221,084$4,600/mo$4,500/mo$4.15Jul 24, 202668
330511793$3,500/mo$3,400/mo$4.29Jul 23, 202654
210511793$3,600/mo$3,700/mo$4.67Jul 10, 202616
1006121,127$3,200/mo$3,200/mo$2.84Jun 30, 202662
1104221,084$4,600/mo$4,600/mo$4.24Jun 29, 202644
2311221,084$4,700/mo$4,700/mo$4.34Jun 26, 202648
2207221,350$5,700/mo$5,350/mo$3.96Jun 22, 202611

The 15 most recent of 37.

Data: Miami Assoc. of REALTORS® MLS via Bridge IDX, as of Nov 2, 2026. Listings matched to this building's recorded addresses; pending includes under-contract. Closed listings shown as records only, no photos. Blanks mean the record doesn't state it. How these numbers are made

The file on The Waverly at South Beach.

The rules on record, the documents in my files, the two Florida checks every buyer should run, and the buildings around it. Each card opens.

FEMA flood zone

AE

Inside FEMA's Special Flood Hazard Area. A federally backed mortgage requires flood insurance here.

What the zone means
  • The 1% annual chance ("100-year") flood area, with a base flood elevation set.
  • Base flood elevation 8 ft (NGVD29).
  • The zone is a map line, not a premium. Ask the association for its master flood policy, and get a flood quote for the specific unit before you commit.

FEMA National Flood Hazard Layer, checked at the building's mapped location on Oct 12, 2026. Open the official map ↗

Milestone structural inspection

Due 2031

Due by statute by December 31, 2031, 30 years after 2001, then every 10 years.

What the deadline means
  • Miami-Dade sets 25 years for condo buildings within three miles of the coastline, which would be December 31, 2026.
  • Based on year built 2001 (county record). The statute counts from the certificate of occupancy date, which can differ.
  • The association must give every owner the inspector's summary. Ask for it, and for the structural integrity reserve study, before you commit.

Fla. Stat. § 553.899(3) ↗ and Miami-Dade recertification ↗, read Oct 9, 2026. What the deadline means for buyers

Nearby

Around The Waverly at South Beach

5 more nearby

Compare with the two nearest →Every South Beach building →Distances are straight-line. Building data from Miami Assoc. of REALTORS® MLS records via Bridge IDX.

Own here, or looking here

Owners: tell me your unit and I'll prepare its value myself. Buyers and renters: I'll tell you when a unit here lists or sells. Either way it starts a conversation with me, not a mailing list.

Own here?

Get your unit's value

Tell me your unit and I'll prepare its value myself, from The Waverly at South Beach's closed sales and what is listed now. Then we talk it through.

Phone or email. One is enough.

Thinking about

Goes to Enrique only. No mailing list.

Looking here?

Get alerts when a unit lists or sells

When a unit at The Waverly at South Beach lists or sells, I'll let you know. I send these myself, not a robot.

Phone or email. One is enough.

Alerts for

Goes to Enrique only. No mailing list.

Enrique Ponte Ojeda on a balcony overlooking the water in Miami
I read the building before you buy or sell a unit in it.Closed history, the association's rules, what is really for sale and what it should trade at. Then we talk.
Enrique Ponte Ojeda
Licensed Florida Real Estate Agent · Carmona Realty Group